Content marketing ROI is the percentage that shows how much revenue you gained compared to what you spent on your content efforts. This comprehensive guide explains how to calculate, measure, and improve your content marketing returns. You’ll learn practical calculation methods, essential metrics to track, and proven strategies to maximize your content investments.
Defining Content Marketing ROI: Beyond Basic Calculations
Content marketing ROI (return on investment) is a percentage that shows how much revenue you gained from content marketing in comparison to what you spent. However, truly understanding content marketing ROI requires looking beyond this simple definition.
The basic formula for calculating content marketing ROI is:
(Return – Investment)/Investment × 100
For example, if you spent $5,000 on content creation and distribution, and generated $15,000 in revenue as a result, your ROI would be:
($15,000 – $5,000)/$5,000 × 100 = 200%
However, the true value of content marketing extends beyond this straightforward calculation. Returns include both direct revenue (sales directly attributed to content) and indirect benefits (brand awareness, customer loyalty, and market positioning). Meanwhile, investment encompasses content creation costs, distribution expenses, technology tools, and staff time.
According to the Content Marketing Institute, good content marketing ROI benchmarks vary by industry, but generally range from 200% to 400% for established programs. New content initiatives may take 6-12 months to achieve positive ROI.
The complexity of accurately measuring content marketing ROI requires a systematic approach that accounts for both immediate returns and long-term value creation.
Quantitative vs. Qualitative ROI Measures
Content marketing ROI encompasses both quantitative (numeric) measures and qualitative (non-numeric) benefits, each providing different insights into your content’s performance.
| Quantitative Measures | Qualitative Measures |
| Conversion rates | Brand perception |
| Revenue generated | Authority building |
| Cost per lead | Customer relationships |
| Traffic growth | Market positioning |
| Engagement metrics | Customer satisfaction |
Assigning value to qualitative benefits requires additional steps. For example, you might measure brand perception through surveys before and after content campaigns, then estimate the financial impact of improved perception based on customer lifetime value increases.
Service businesses often focus more on qualitative measures, as their sales cycles tend to be longer and more relationship-driven. E-commerce companies typically prioritize quantitative metrics like direct conversion rates and revenue per visit.
The most effective approach combines both measurement types to create a comprehensive view of your content’s impact.
Why Measuring Content Marketing ROI Matters
Measuring content marketing ROI isn’t just about justifying your budget. It’s about optimizing your entire content strategy for maximum business impact.
According to the latest Content Marketing Institute annual report, 73% of organizations increased their content marketing budgets last year. However, only 35% report having a documented content strategy with clear ROI targets. This disconnect highlights the importance of robust measurement practices.
Here are the key business benefits of measuring content marketing ROI:
- Budget justification: Concrete ROI figures help secure continued or increased investment in content initiatives
- Resource optimization: Identifying high-performing content types allows for more efficient resource allocation
- Strategy refinement: Data-driven insights guide more effective content approaches
- Performance improvement: Ongoing measurement creates feedback loops for continuous optimization
- Cross-channel comparison: Standardized ROI measures enable fair comparison with other marketing channels
Consider the case of software company Tableau. By implementing comprehensive ROI tracking, they discovered their long-form technical guides generated 3x more qualified leads than their blog posts, despite higher production costs. This insight led them to reallocate 40% of their blog budget to in-depth guides, resulting in a 65% increase in overall content marketing ROI.
A common misconception is that content marketing is purely a brand-building activity that can’t be measured precisely. In reality, with the right tracking systems and attribution models, you can measure content’s impact throughout the customer journey.
The Content Marketing ROI Formula: Step-by-Step Calculation
Calculating content marketing ROI follows a systematic process that begins with proper tracking and ends with actionable insights. Here’s how to do it effectively.
While the basic formula (Return – Investment)/Investment × 100 looks simple, implementing it requires careful planning and execution:
Step 1: Define Your Investment
Track all costs associated with your content, including:
- Content creation (writing, design, video production)
- Content distribution (paid promotion, email marketing)
- Technology tools (content management, analytics, automation)
- Team time (planning, creation, management, analysis)
- Outsourcing and agency fees
Step 2: Set Up Proper Tracking
Implement systems to connect content consumption to business outcomes:
- UTM parameters for campaign tracking
- Goal tracking in analytics platforms
- Lead source identification in CRM
- Conversion path analysis
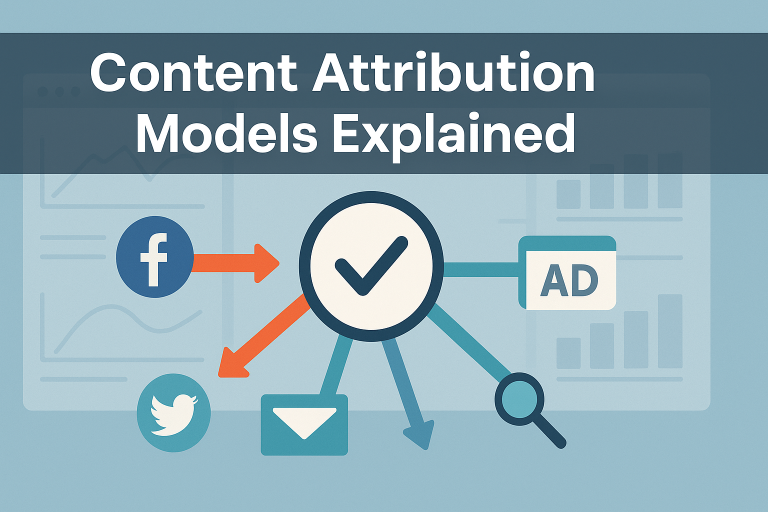
Step 3: Choose Your Attribution Model
Select how you’ll attribute conversions to content touchpoints:
- First-touch: Credits the first content interaction
- Last-touch: Credits the final content interaction
- Linear: Distributes credit equally across all touchpoints
- Time-decay: Gives more credit to more recent touchpoints
- Position-based: Emphasizes first and last touchpoints
Step 4: Calculate Returns
Measure both direct and indirect returns:
- Direct revenue from content-influenced sales
- Cost savings from improved customer service or reduced advertising
- Value of leads generated
- Estimated value of brand building and authority creation
Real Example: Blog Post Campaign ROI
A B2B software company launched a series of 5 in-depth blog posts about industry trends:
Investment:
- Content creation: $5,000 ($1,000 per post)
- Design elements: $1,500
- Paid promotion: $2,500
- Staff time: $3,000 (60 hours at $50/hour)
- Total investment: $12,000
Returns (6-month period):
- Lead value: 80 leads × $200 average value = $16,000
- Direct sales: $15,000 (tracked through attribution)
- Total return: $31,000
ROI Calculation:
($31,000 – $12,000)/$12,000 × 100 = 158%
Different content types require adjusted approaches. For example, social media content might focus on engagement metrics and brand awareness value, while white papers emphasize lead quality and sales acceleration.
When measuring ROI, consider both short-term returns (0-3 months) and long-term value (6-24 months). Evergreen content often delivers increasing returns over time as it accumulates search authority and continues driving traffic.
Common calculation pitfalls include forgetting to include all costs (especially staff time), attributing all sales to content when other channels contributed, and expecting immediate returns from content types that typically deliver long-term value.
Accounting for Total Content Investment
Accurately calculating content marketing ROI requires accounting for all investment costs, both obvious and hidden.
A comprehensive content investment calculation includes:
- Direct creation costs: Writer fees, design work, video production, audio recording
- Production tools: Software subscriptions, equipment, stock photos/videos
- Distribution expenses: Paid social promotion, email marketing, influencer partnerships
- Staff time: Planning, creation, editing, publishing, promotion, analysis
- Management overhead: Strategy development, team coordination, vendor management
- Technology infrastructure: Content management systems, analytics platforms, marketing automation
To calculate staff time costs, use this formula:
(Hourly rate × Hours spent) × 1.25 (to account for overhead)
For example, if a content manager earning $35/hour spends 10 hours on a project, the true cost is: ($35 × 10) × 1.25 = $437.50
Many organizations overlook costs like content updates and maintenance, opportunity costs of team members’ time, and technology infrastructure allocations. Create a dedicated content cost tracking spreadsheet with categories for each expense type and allocate costs by content piece or campaign.
Attribution Models for Content Marketing
Connecting content marketing efforts to revenue requires choosing the right attribution model for your business situation.
Each attribution model distributes conversion credit differently across touchpoints:
- First-touch attribution: Assigns 100% of credit to the first content interaction
- Pros: Simple to implement, highlights top-of-funnel effectiveness
- Cons: Ignores later influences on the decision
- Best for: Short sales cycles, impulse purchases
- Last-touch attribution: Assigns 100% of credit to the final content interaction before conversion
- Pros: Easy to track, focuses on conversion triggers
- Cons: Undervalues awareness and consideration content
- Best for: Simple purchase decisions, direct response campaigns
- Linear attribution: Distributes credit equally across all content touchpoints
- Pros: Recognizes all influences, simple to understand
- Cons: Doesn’t reflect varying importance of touchpoints
- Best for: Balanced understanding of content journey
- Time-decay attribution: Gives more credit to touchpoints closer to conversion
- Pros: Reflects recency bias in decision-making
- Cons: Undervalues early awareness building
- Best for: Longer sales cycles with multiple considerations
- Position-based (U-shaped) attribution: Gives 40% credit each to first and last touches, 20% divided among middle touches
- Pros: Emphasizes critical introduction and decision points
- Cons: May oversimplify middle-journey influences
- Best for: Complex B2B sales with defined awareness and decision stages
For example, a white paper download that initiated a customer relationship might receive 100% credit under first-touch attribution but only 20% under linear attribution if four other content pieces were consumed before purchase.
B2B companies with complex sales cycles typically benefit from position-based or time-decay models, while e-commerce businesses often find last-touch or linear models more practical.
Essential Content Marketing Metrics for ROI Measurement
Effective content marketing ROI measurement relies on tracking the right metrics at each stage of the customer journey.
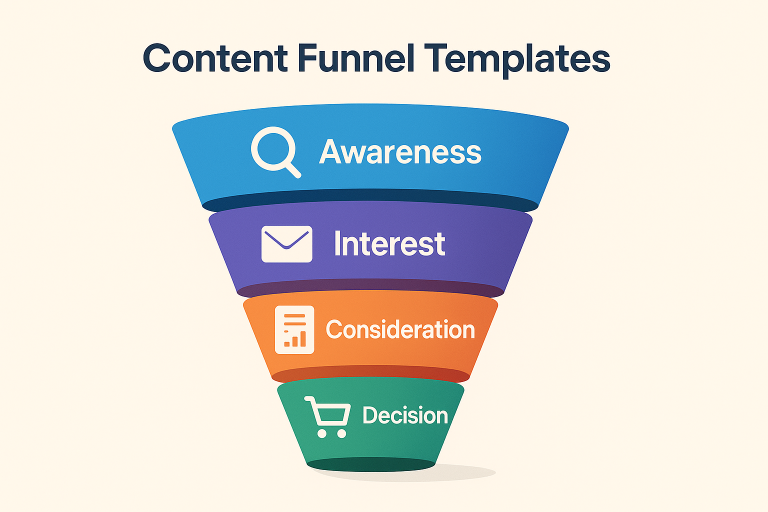
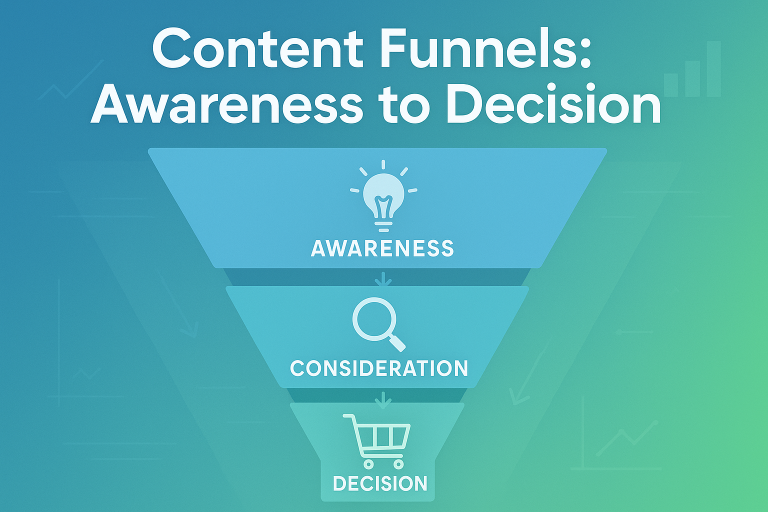
A comprehensive measurement approach organizes metrics by funnel stage to create a complete picture of content performance:
Awareness Stage Metrics
- Organic traffic: Visitors from search engines
- How to track: Google Analytics acquisition reports
- ROI connection: Foundation for all content-driven conversions
- Social reach: Impressions and engagement on social platforms
- How to track: Native platform analytics
- ROI connection: Indicates audience growth potential
- Brand search volume: People searching directly for your brand
- How to track: Google Search Console, Google Trends
- ROI connection: Measures brand awareness growth
- Content impressions: How often content is displayed
- How to track: Analytics platforms, ad managers
- ROI connection: Measures potential audience reach
Consideration Stage Metrics
- Time on page: How long visitors engage with content
- How to track: Google Analytics behavior reports
- ROI connection: Indicates content quality and relevance
- Pages per session: How many content pieces users consume
- How to track: Google Analytics behavior reports
- ROI connection: Shows engagement depth
- Return visits: How often users come back for more content
- How to track: Google Analytics audience reports
- ROI connection: Indicates relationship building
- Email opt-ins: Users joining your email list from content
- How to track: Email platform, form analytics
- ROI connection: Creates ongoing marketing opportunities
Conversion Stage Metrics
- Conversion rate: Percentage of visitors who complete desired actions
- How to track: Analytics goal tracking
- ROI connection: Directly impacts revenue generation
- Content-attributed revenue: Sales connected to content touchpoints
- How to track: CRM attribution, analytics goals
- ROI connection: Direct revenue measurement
- Customer acquisition cost (CAC): Cost to acquire a customer through content
- How to track: Total content costs divided by new customers
- ROI connection: Efficiency measure for acquisition
- Customer lifetime value (CLV): Total value of customers acquired through content
- How to track: CRM data analysis
- ROI connection: Measures long-term return potential
Different business types should prioritize different metrics. E-commerce companies should focus on traffic, conversion rates, and average order value. B2B companies should emphasize lead quality, sales velocity, and customer lifetime value. Service businesses should track consultation requests, qualified leads, and client retention.
For accurate ROI measurement, implement Google Analytics 4 with conversion tracking, CRM integration for lead and customer tracking, and content-specific tracking codes to connect consumption to outcomes.
Traffic and Awareness Metrics
Top-of-funnel metrics may not directly tie to revenue, but they’re essential for understanding your content’s reach and initial engagement.
Key awareness metrics to track include:
- Organic traffic: Visitors coming from search engines without paid promotion
- Benchmark: 10-15% month-over-month growth for new content
- Value connection: Each visitor has potential conversion value based on your average conversion rate
- Social shares: How often your content is shared across platforms
- Benchmark: Industry-dependent, typically 0.5-2% of viewers share content
- Value connection: Each share expands reach by an average of 300 impressions
- Search visibility: How many keywords your content ranks for
- Benchmark: Top-performing content should rank for 20+ related terms
- Value connection: Higher rankings drive sustainable traffic without ongoing investment
- Brand mentions: References to your brand across the web
- Benchmark: Growth correlating with content publication volume
- Value connection: Indicates brand awareness expansion
To assign ROI value to awareness metrics, calculate the equivalent paid advertising cost to achieve the same reach. For example, if your content organically reaches 10,000 people, and your industry average cost-per-thousand impressions (CPM) is $25, that content delivered $250 in equivalent media value.
Research shows awareness metrics strongly predict future conversions. Content driving high engagement typically generates 3-5x more conversions over a 90-day period compared to low-engagement content.
Engagement and Consideration Metrics
Mid-funnel engagement metrics reveal how effectively your content moves prospects closer to conversion.
Track these key engagement metrics to evaluate content quality and effectiveness:
- Time on page: How long visitors spend consuming your content
- Benchmark: 2-3 minutes for blog posts, 3-5 minutes for in-depth guides
- Quality indicator: Longer engagement suggests higher value delivery
- Pages per session: Number of content pieces consumed in one visit
- Benchmark: 1.5-2.5 pages for informational content, 3-4 for product research
- Quality indicator: More pages suggests stronger interest development
- Return visits: Percentage of visitors who come back for more content
- Benchmark: 15-25% return rate for quality content programs
- Quality indicator: Higher return rates show relationship building
- Email opt-ins: Visitors who subscribe to receive more content
- Benchmark: 1-3% for general content, 5-10% for targeted lead magnets
- Quality indicator: Willingness to share contact information
- Content downloads: Resources users value enough to download
- Benchmark: 2-5% download rate for gated content offers
- Quality indicator: Perceived value high enough to exchange information
For blog content, average time on page below 45 seconds indicates poor engagement, while over 2 minutes suggests strong interest. Video content typically maintains 50-60% audience retention through the first minute, with 15-30% completing longer videos.
Content with high engagement metrics converts at 2-3x the rate of content with below-average engagement, making these metrics critical leading indicators of ROI potential.
Conversion and Revenue Metrics
Bottom-of-funnel conversion metrics directly connect your content to revenue generation and provide the clearest ROI indicators.
These essential conversion metrics form the foundation of content marketing ROI calculation:
- Conversion rate: Percentage of content consumers who complete desired actions
- Benchmark: 1-3% for lead generation, 0.5-2% for direct purchases
- Revenue connection: Direct driver of content-attributed revenue
- Lead quality: Qualification level of content-generated leads
- Benchmark: 10-30% of content leads should qualify for sales follow-up
- Revenue connection: Determines potential value of lead generation
- Sales velocity: How quickly content leads convert to customers
- Benchmark: 10-25% faster sales cycles for educated leads
- Revenue connection: Accelerates revenue realization
- Customer acquisition cost (CAC): Total cost to acquire a customer through content
- Benchmark: 25-40% lower than paid advertising acquisition
- Revenue connection: Determines ROI efficiency
- Lifetime value (LTV): Total revenue from content-acquired customers
- Benchmark: Often 15-30% higher than other acquisition channels
- Revenue connection: Establishes long-term content ROI
To set up proper tracking for conversion metrics, implement these essentials:
- Configure goal tracking in Google Analytics for all conversion actions
- Set up UTM parameters to track content source and medium
- Implement CRM lead source tracking to connect content to sales
- Create multi-touch attribution models to track content influence throughout the journey
Research shows content directly influences purchase decisions, with 47% of B2B buyers consuming 3-5 content pieces before engaging with sales, and 70% of consumers researching through content before making significant purchases.
Common Challenges in Measuring Content Marketing ROI
Even experienced marketers face significant challenges when measuring content marketing ROI. Understanding these challenges is the first step to overcoming them.
Challenge 1: Long Sales Cycles
Content often influences purchases that happen weeks or months later, making direct attribution difficult.
Solution: Implement multi-touch attribution tracking that follows users across the entire customer journey. Use time-decay models that account for different touchpoints over extended periods.
Example: Software company HubSpot uses a combination of cookies, email tracking, and CRM integration to connect early-stage blog consumption to sales that occur 6-12 months later.
Challenge 2: Multiple Touchpoints
Most conversions involve multiple content interactions across various channels, complicating attribution.
Solution: Use position-based attribution models that credit both first-touch (awareness) and last-touch (decision) content while also acknowledging middle interactions.
Example: Marketing agency New Breed tracks average touchpoint patterns, finding that most B2B conversions involve 8 content interactions before purchase. They assign weighted values to each typical touchpoint.
Challenge 3: Indirect Conversions
Content consumers often convert through different channels like direct traffic or search.
Solution: Implement cross-device tracking and use assisted conversion reports in analytics to understand how content supports conversions attributed to other channels.
Example: Retailer REI found that blog readers were 15% more likely to purchase within 30 days, even when returning directly to the site rather than clicking from content.
Challenge 4: Quantifying Qualitative Benefits
Brand authority, trust, and positioning are valuable but difficult to measure in revenue terms.
Solution: Use surveys to establish baseline metrics for brand perception, then track changes over time as content programs expand. Assign estimated value to improvements.
Example: Financial services firm Wealthfront conducts quarterly brand perception surveys and has established that each 5-point increase in trust scores correlates with approximately 8% increase in conversion rates.
Challenge 5: Data Silos
Content performance data often lives in multiple systems (analytics, CRM, social platforms) without integration.
Solution: Invest in integration tools that connect marketing automation, CRM, and analytics platforms. Create central dashboards for unified reporting.
Example: Marketing technology company Airship built custom API connections between their content management system, Salesforce CRM, and Google Analytics to create real-time content ROI reporting.
According to Joe Pulizzi, founder of Content Marketing Institute, “The organizations that excel at content marketing ROI measurement are those that plan for measurement from the beginning, not those that try to retrofit tracking onto existing programs.”
Tools and Technologies for Measuring Content Marketing ROI
The right technology stack makes content marketing ROI measurement more accurate and less time-consuming.
Analytics Platforms
- Google Analytics 4: Essential foundation for tracking user behavior and conversions
- Key features: Event-based tracking, conversion paths, audience insights
- Implementation tip: Set up proper event tracking for all content interactions
- Cost: Free for standard features
- Adobe Analytics: Enterprise-level solution with advanced attribution
- Key features: Cross-channel attribution, predictive analytics, custom variables
- Implementation tip: Requires significant configuration for content-specific tracking
- Cost: Starting around $50,000 annually
Attribution Tools
- Dreamdata: B2B revenue attribution platform
- Key features: Multi-touch attribution, content journey mapping, revenue allocation
- Implementation tip: Integrate with CRM for full journey tracking
- Cost: Starting at $1,500/month
- Attribution: Marketing attribution platform focused on content
- Key features: Content-specific journey analysis, ROI forecasting
- Implementation tip: Use their Chrome extension for quick content analysis
- Cost: Starting at $500/month
Content Performance Platforms
- Contently: Content analytics with ROI measurement
- Key features: Content scoring, engagement analytics, conversion tracking
- Implementation tip: Connect to CRM to track content-influenced revenue
- Cost: Starting at $2,000/month
- Parse.ly: Content analytics focused on engagement and conversions
- Key features: Real-time content performance, audience insights, conversion paths
- Implementation tip: Set up conversion events for all key business actions
- Cost: Starting at $500/month
CRM Integrations
- HubSpot: Marketing automation with content attribution
- Key features: Content tracking, lead source attribution, revenue reporting
- Implementation tip: Use their tracking codes on all content
- Cost: Starting at $800/month for marketing hub
- Salesforce: CRM with campaign influence tracking
- Key features: Campaign influence models, opportunity attribution
- Implementation tip: Set up content as individual campaigns
- Cost: Starting at $25/user/month plus Pardot ($1,250/month)
For small businesses with limited budgets, start with Google Analytics 4 (free) combined with UTM tracking and a simple spreadsheet for content costs. This provides basic ROI tracking for under $100 monthly.
Mid-size companies should consider investing in an integrated marketing platform like HubSpot ($800-1,500/month) or a specialized content analytics tool like Parse.ly ($500-1,000/month) for more comprehensive tracking.
Enterprise organizations typically need multi-tool stacks with custom integrations, with costs ranging from $5,000 to $15,000 monthly for comprehensive content ROI tracking.
The ROI of measurement tools themselves can be substantial. Companies implementing proper attribution typically discover 15-30% of previously uncredited revenue influence from content, justifying the technology investment.
Strategies to Improve Your Content Marketing ROI
Once you’ve established your content marketing ROI measurement system, use these proven strategies to systematically improve your returns.
Strategy 1: Conduct a Content Audit and Optimization
Analyze your existing content to identify high and low performers.
Implementation steps:
- Catalog all content assets with performance metrics
- Identify top 20% performers and bottom 30% underperformers
- Update and optimize underperforming content with high potential
- Consolidate or remove truly poor performers
- Expand and repurpose top performers into additional formats
ROI impact: Companies like Ahrefs have increased organic traffic by 30-40% through systematic content auditing without creating new content.
Strategy 2: Optimize Distribution Channels
Maximize the reach and impact of content through strategic distribution.
Implementation steps:
- Analyze which channels drive highest-value traffic
- Create channel-specific versions of successful content
- Develop a systematic promotion schedule for new and updated content
- Test paid promotion on high-converting content pieces
- Build partnerships for content syndication
ROI impact: Software company Buffer increased content ROI by 117% by optimizing distribution channels while maintaining the same content creation budget.
Strategy 3: Implement Strategic Content Repurposing
Extract maximum value from successful content by transforming it into multiple formats.
Implementation steps:
- Identify comprehensive pieces with strong performance
- Break into smaller, focused pieces for different channels
- Convert written content to video, audio, and visual formats
- Create content series from comprehensive guides
- Develop lead magnets from high-value content
ROI impact: Minimum viable content testing with repurposing has shown that companies can triple content reach while reducing creation costs by 40-60%.
Strategy 4: Optimize for SEO Based on Performance Data
Use performance insights to improve search visibility and traffic quality.
Implementation steps:
- Identify content ranking on page two or lower of search results
- Analyze search intent for target keywords
- Update content to better match intent and add missing subtopics
- Improve internal linking to priority content
- Add schema markup for enhanced search visibility
ROI impact: Marketing platform HubSpot increased organic traffic value by $13.5 million annually through systematic historical optimization.
Strategy 5: Optimize Conversion Paths
Improve how content converts visitors into leads and customers.
Implementation steps:
- Map current conversion paths from content consumption to action
- Identify drop-off points in the journey
- A/B test call-to-action placement, design, and copy
- Create content-specific landing pages for major pieces
- Implement progressive profiling for repeat visitors
ROI impact: Conversion optimization typically yields 50-200% improvements in content conversion rates, directly increasing ROI.
Strategy 6: Refine Audience Targeting
Focus content on the most valuable audience segments.
Implementation steps:
- Analyze which audience segments generate highest customer value
- Develop detailed personas for high-value segments
- Create content addressing specific pain points for each segment
- Implement content personalization based on behavior
- Develop segment-specific content journeys
ROI impact: B2B companies implementing audience segmentation see 20-30% higher content engagement and 2x higher conversion rates.
When prioritizing these strategies, start with conversion optimization and content auditing, as these typically deliver the fastest ROI improvements within 30-60 days. Follow with distribution optimization and repurposing, which usually show results within 60-90 days. Finally, implement SEO optimization and audience refinement, which build sustainable ROI improvements over 90-180 days.
Content Audit Framework for ROI Optimization
A systematic content audit reveals which content assets deliver the highest ROI and which need improvement or retirement.
Follow this step-by-step process to conduct an ROI-focused content audit:
- Create a comprehensive content inventory
- List all content assets across all platforms
- Record basic information: title, URL, content type, publish date
- Add target keywords and topics
- Collect performance metrics for each asset
- Traffic data: pageviews, unique visitors, traffic sources
- Engagement metrics: time on page, bounce rate, scroll depth
- Conversion data: leads generated, sales influenced
- SEO metrics: keyword rankings, backlinks
- Calculate ROI for each content piece
- Estimate creation and promotion costs
- Calculate total value generated (leads, sales, etc.)
- Determine ROI percentage using standard formula
- Categorize content into action groups
- High performers (keep and promote)
- Solid performers (minor updates)
- Underperformers with potential (major updates)
- Poor performers (consolidate or remove)
- Develop action plans for each category
- Create promotion plans for high performers
- Schedule updates for solid performers
- Prioritize major revisions for high-potential underperformers
- Plan consolidation or removal of poor performers
When evaluating content performance, use these criteria:
- Traffic value: Volume and quality of visitors attracted
- Engagement quality: How deeply visitors interact with content
- Conversion effectiveness: Lead or sale generation capability
- SEO performance: Search visibility and ranking strength
- Social engagement: Sharing and discussion generation
- Sales enablement value: Usefulness in sales process
For example, digital marketing agency Animalz conducted a content audit for a SaaS client and found that 15% of their blog posts generated 65% of their leads. By updating these high-performers and creating similar content, they increased content marketing ROI by 85% within six months.
Content Distribution and Promotion for Maximum ROI
Even the best content needs strategic distribution to maximize ROI. Your promotion strategy often impacts returns more than the content itself.
Match distribution strategies to content types for optimal results:
- In-depth guides and reports
- Primary channels: Email to segmented lists, LinkedIn, industry forums
- Promotion tactics: Executive summaries, slideshares, webinars
- ROI impact: Typically generates 3-5x more leads than standard blog promotion
- Blog posts and articles
- Primary channels: Social media, email newsletters, search optimization
- Promotion tactics: Quote outreach, social snippets, community sharing
- ROI impact: Proper promotion can double or triple content views
- Video content
- Primary channels: YouTube, social platforms, embedded in related content
- Promotion tactics: Teasers, transcriptions, highlight clips
- ROI impact: Multi-platform distribution increases views by 200-300%
- Case studies
- Primary channels: Sales enablement, email nurture, website
- Promotion tactics: Results highlights, customer quotes, industry comparisons
- ROI impact: Strategic distribution increases lead-to-opportunity conversion by 30-40%
When comparing paid vs. organic promotion ROI:
| Promotion Type | Typical ROI Range | Best For |
| Organic social | 150-300% | Community building, thought leadership |
| Paid social | 100-200% | Lead generation, specific targeting |
| Email marketing | 300-500% | Nurturing existing audiences |
| Influencer partnerships | 200-400% | Reaching new relevant audiences |
| Content syndication | 100-300% | Expanding reach to targeted readers |
Marketing platform Semrush discovered that implementing a systematic distribution plan for their content increased ROI by 187%. Their approach included creating 5-7 social posts per piece, developing email sequences, and implementing a 30-day promotion calendar for each major content asset.
Similarly, starting with content marketing ROI measurement from the beginning allows you to identify which distribution channels deliver the best returns for different content types, helping you optimize promotion budgets accordingly.
Content Marketing ROI by Industry: Benchmarks and Expectations
Content marketing ROI varies significantly by industry due to differences in sales cycles, conversion values, and content consumption patterns.
Industry-specific benchmarks can help you set realistic expectations and goals:
B2B Technology
- Average ROI range: 200-400%
- Timeline to positive ROI: 6-9 months
- Top-performing content: Technical guides, solution comparisons, industry reports
- Key success factors: Technical accuracy, problem-solution focus, audience targeting
According to research by Forrester, B2B technology companies see $2.54 in pipeline value for every $1 spent on content marketing.
E-commerce
- Average ROI range: 300-500%
- Timeline to positive ROI: 3-6 months
- Top-performing content: Buying guides, product comparisons, how-to content
- Key success factors: Visual quality, product relevance, seasonal timing
DemandMetric reports that e-commerce companies using content marketing see 6x higher conversion rates than those not using content strategies.
Financial Services
- Average ROI range: 150-300%
- Timeline to positive ROI: 9-12 months
- Top-performing content: Educational guides, calculators, market analyses
- Key success factors: Trust building, compliance, data accuracy
According to Financial Brand, financial institutions with strong content programs generate 3x more leads at 62% lower cost than traditional marketing.
Healthcare
- Average ROI range: 200-350%
- Timeline to positive ROI: 6-9 months
- Top-performing content: Condition guides, treatment comparisons, expert interviews
- Key success factors: Medical accuracy, empathy, regulatory compliance
Healthcare Marketing Institute found that healthcare providers using content marketing see 41% lower patient acquisition costs.
Professional Services
- Average ROI range: 250-450%
- Timeline to positive ROI: 6-12 months
- Top-performing content: Case studies, thought leadership, process guides
- Key success factors: Expertise demonstration, credibility building, problem framing
Professional services firms typically see 5-7x higher client acquisition rates through content-driven strategies than through traditional outbound methods.
Manufacturing
- Average ROI range: 150-250%
- Timeline to positive ROI: 9-15 months
- Top-performing content: Application guides, specification comparisons, industry trend analysis
- Key success factors: Technical accuracy, specification details, solution focus
Manufacturing companies using content marketing generate 67% more leads than those relying on traditional marketing, according to Content Marketing Institute research.
According to Joe Pulizzi, founder of Content Marketing Institute, “The industries seeing the highest content marketing ROI are those that align their content creation with specific customer pain points and buying journey stages, regardless of sector.”
B2B vs. B2C Content Marketing ROI Differences
B2B and B2C content marketing have fundamentally different ROI patterns due to variations in sales cycles, decision-making processes, and purchase values.
| Factor | B2B Content Marketing | B2C Content Marketing |
| Average ROI timeline | 6-12 months | 3-6 months |
| Top-performing formats | White papers, case studies, webinars | Blogs, videos, social content |
| Key metrics | Lead quality, sales velocity, LTV | Conversion rate, AOV, repeat purchase |
| Average content costs | $2,000-$10,000 per asset | $500-$5,000 per asset |
| Conversion patterns | Multiple touches over extended period | Fewer touches, shorter timeframe |
| Content value drivers | Expertise, specificity, problem-solving | Engagement, emotion, simplicity |
| ROI calculation focus | Pipeline influence, sales acceleration | Direct conversion, purchase value |
B2B content typically supports higher-value transactions ($5,000-$100,000+) with multiple decision-makers, requiring more in-depth content and longer nurturing periods. This results in higher potential ROI but over extended timeframes.
B2C content supports lower individual transaction values but with higher volumes and faster decision cycles. This creates opportunities for quicker ROI realization but often at lower percentage returns.
For B2B content marketing, position-based or time-decay attribution models work best due to lengthy sales cycles. For B2C, last-click or linear models often provide more accurate ROI measurement due to shorter consideration periods.
Communicating Content Marketing ROI to Stakeholders
Successfully demonstrating content marketing ROI to executives and stakeholders requires translating complex metrics into business impact stories.
Create targeted ROI reports for different audiences:
For C-Suite Executives
- Focus on: Revenue impact, resource efficiency, competitive advantage
- Key metrics to highlight: Revenue influenced, customer acquisition cost, market share indicators
- Presentation format: Executive summary with 3-5 key insights, high-level metrics dashboard
- Language recommendations: Use business terminology, avoid marketing jargon, focus on outcomes
For Finance Teams
- Focus on: Cost efficiency, resource allocation, return calculation methodology
- Key metrics to highlight: Detailed ROI calculations, cost breakdowns, efficiency comparisons
- Presentation format: Detailed spreadsheets with cost-benefit analysis, quarterly trend reports
- Language recommendations: Use financial terminology, provide detailed methodologies, show work
For Sales Teams
- Focus on: Lead quality, sales enablement, customer education
- Key metrics to highlight: Lead conversion rates, sales cycle impact, content utilization
- Presentation format: Sales-content alignment maps, content performance by sales stage
- Language recommendations: Use sales terminology, focus on pipeline impact, highlight customer stories
For Board Members
- Focus on: Strategic impact, competitive positioning, long-term value
- Key metrics to highlight: Market share indicators, customer acquisition trends, brand authority measures
- Presentation format: Quarterly executive summary with strategic implications
- Language recommendations: Connect to business strategy, use benchmark comparisons, provide context
When visualizing ROI data, follow these best practices:
- Use simple, clear charts focusing on trends rather than complex data
- Compare content marketing ROI against other marketing channels
- Include both short-term metrics and long-term value indicators
- Provide industry benchmarks for context
- Use progressive disclosure (high-level summary with ability to drill down)
A sample dashboard template should include:
- Content program summary (investments, returns, ROI percentage)
- Top-performing content by revenue influence
- Content ROI trends over time (quarter-by-quarter)
- Channel comparison (content vs. other marketing approaches)
- Next-quarter forecast and recommendations
When addressing common stakeholder objections about content marketing ROI, be prepared with specific answers:
- Objection: “Content takes too long to generate returns”
- Response: “Our data shows initial returns begin at 3 months, with break-even at 6 months and exponential growth thereafter”
- Objection: “We can’t directly attribute sales to content”
- Response: “Our attribution model shows content influences 35% of pipeline value, with specific tracking of how content moves prospects through stages”
The Future of Content Marketing ROI Measurement
Content marketing ROI measurement is evolving rapidly due to technological changes, privacy regulations, and advances in attribution modeling.
AI in Content Analytics
Artificial intelligence is transforming how we understand content performance and attribution.
Key developments:
- Natural language processing to analyze content quality and topic relevance
- Predictive analytics forecasting content performance before publication
- Automated content recommendations based on performance patterns
- AI-driven attribution modeling that identifies subtle influence patterns
Timeline: 50% of enterprise content teams will use AI-powered analytics by 2025
Privacy-First Measurement Approaches
Cookie deprecation and privacy regulations are forcing new measurement methodologies.
Key developments:
- Shift from individual tracking to cohort-based analysis
- First-party data strategies replacing third-party tracking
- Probabilistic attribution models based on aggregate behaviors
- Increased emphasis on owned channels for tracking
Timeline: Complete transformation of tracking methodologies by 2024-2025
Predictive Content ROI Modeling
Advanced analytics will enable forward-looking ROI projections.
Key developments:
- Predictive lifetime value models for content-acquired customers
- AI-powered content scoring before publication
- Automated content investment recommendations
- Continuous optimization based on real-time data
Timeline: Early adoption in 2023-2024, mainstream by 2025
Integrated Measurement Platforms
Unified tools will connect content performance across the entire customer journey.
Key developments:
- All-in-one platforms connecting content, marketing, and sales data
- Automated multi-touch attribution across channels
- Real-time ROI dashboards with predictive capabilities
- Cross-platform content performance visualization
Timeline: Leading platforms launching in 2023, market consolidation by 2025
Customer Journey Analytics
Focus will shift from individual content pieces to complete journey mapping.
Key developments:
- Journey-based attribution replacing touchpoint models
- Content sequencing optimization for maximum conversion
- Personalized content journeys based on behavior patterns
- Cross-device journey tracking improvements
Timeline: Early adopters in 2023, mainstream by 2024-2025
According to Ann Handley, Chief Content Officer at MarketingProfs, “The future of content ROI measurement isn’t about better tracking individual pieces, but understanding how content works together as an ecosystem to move customers through their buying journey.”
To prepare for these changes, marketers should:
- Invest in first-party data collection and management
- Develop content tagging and metadata frameworks
- Build customer journey maps for content consumption
- Experiment with AI-powered content analytics tools
- Focus on creating trackable content experiences
Content Marketing ROI Case Studies
These real-world examples demonstrate how different organizations have successfully measured and improved their content marketing ROI.
Case Study 1: B2B Software Company
Background: A mid-size SaaS provider with a $500,000 annual content budget struggled to connect content efforts to pipeline generation and sales.
Challenge: Multiple stakeholders questioned content investment due to inability to demonstrate ROI. Sales cycles averaged 90 days with 5-7 decision makers involved.
Approach:
- Implemented multi-touch attribution tracking through HubSpot and Salesforce integration
- Created content scoring system based on engagement and conversion patterns
- Developed content-specific lead nurturing workflows tied to sales stages
- Established quarterly content ROI reporting with revenue influence metrics
- Optimized content mix based on performance data (more case studies, fewer general blogs)
Results:
- Identified that content influenced 78% of all won deals
- Demonstrated 285% ROI on content investments
- Reduced average sales cycle by 23% through strategic content deployment
- Increased content budget by 35% based on proven returns
Key Lesson: Integration between marketing automation and CRM systems was crucial for accurate attribution and ROI calculation.
Case Study 2: E-commerce Retailer
Background: An outdoor equipment retailer with $10M annual revenue invested heavily in product-focused content but couldn’t measure impact on sales.
Challenge: Determining which content types drove purchases and what topics generated highest returns on investment.
Approach:
- Implemented content-specific tracking codes and UTM parameters
- Created a content ROI dashboard connecting Google Analytics with e-commerce data
- Conducted A/B testing of content types and topics to identify high performers
- Developed topic clusters around high-ROI content areas
- Implemented post-purchase surveys to identify content influence
Results:
- Discovered how-to guides generated 340% ROI compared to 120% for product-focused content
- Identified that content-influenced purchases had 27% higher average order value
- Increased overall content ROI from 160% to 275% in 12 months
- Reduced content production costs by 30% through focus on high-performing formats
Key Lesson: Educational content focusing on product usage generated significantly higher ROI than product-focused content alone.
Case Study 3: Financial Services Firm
Background: A wealth management company needed to demonstrate how their thought leadership content impacted client acquisition.
Challenge: Long sales cycles (12+ months) and multiple touchpoints made attribution difficult, with compliance limitations on tracking.
Approach:
- Developed progressive profiling to track content consumption without privacy issues
- Created a content influence model based on engagement patterns
- Implemented value-based scoring for different content interactions
- Conducted regular client surveys about content impact on decisions
- Used time-decay attribution to account for long consideration periods
Results:
- Proved content-engaged prospects converted at 3.2x the rate of non-engaged prospects
- Demonstrated 215% ROI on thought leadership content
- Showed that clients acquired through content had 40% higher lifetime value
- Secured 50% increase in content budget based on proven impact
Key Lesson: For complex sales with regulatory limitations, combining engagement metrics with client research created accurate ROI measurement despite attribution challenges.
According to Brian Clark, founder of Copyblogger, “These case studies demonstrate that effective content marketing ROI measurement isn’t about perfect attribution, but about creating systems that connect content engagement patterns to business outcomes in ways that drive better decisions.”
Conclusion: Building a ROI-Driven Content Marketing Strategy
Content marketing ROI measurement isn’t just an analytical exercise. It’s the foundation of a strategic, results-driven content approach.
Throughout this guide, we’ve explored how to define, calculate, measure, and improve content marketing ROI. The key principles include:
- Content marketing ROI combines both quantitative measures (direct revenue) and qualitative benefits (brand authority)
- Effective measurement requires proper tracking systems, attribution models, and comprehensive metrics
- ROI calculation must account for all content investments, including creation, distribution, and team time
- Different industries and business models have varying ROI patterns and expectations
- Systematic optimization strategies can significantly improve content returns
To implement ROI measurement in your organization, follow this action plan:
- Audit your current content and establish performance baselines
- Implement proper tracking and attribution systems
- Define your key metrics across the funnel stages
- Create regular reporting processes for stakeholders
- Develop optimization strategies based on performance data
As Robert Rose, Chief Strategy Advisor at Content Marketing Institute, says, “The organizations that win with content aren’t necessarily those who create the most or spend the most. They’re the ones who measure carefully, learn continuously, and optimize relentlessly based on ROI data.”
Remember that content marketing ROI isn’t static. It’s a continuous process of measurement, learning, and improvement. By establishing systematic approaches to tracking and optimization, you’ll create a content program that delivers increasingly valuable returns over time.
The investment you make in measuring content marketing ROI today will pay dividends through more effective content, better resource allocation, and stronger business results tomorrow.