Content marketing funnels create pathways to conversion. But without proper measurement, you’re flying blind. This guide reveals 21 essential metrics to track across every funnel stage, helping you prove ROI and optimize performance. You’ll learn exactly which KPIs matter most, how to measure them, and which tools make tracking simple.
Understanding the Content Marketing Funnel Structure
Before diving into specific metrics, it’s essential to understand how the content marketing funnel is structured and how it differs from traditional marketing funnels. A content marketing funnel guides potential customers through their journey from initial awareness to final purchase and beyond through strategic content delivery.
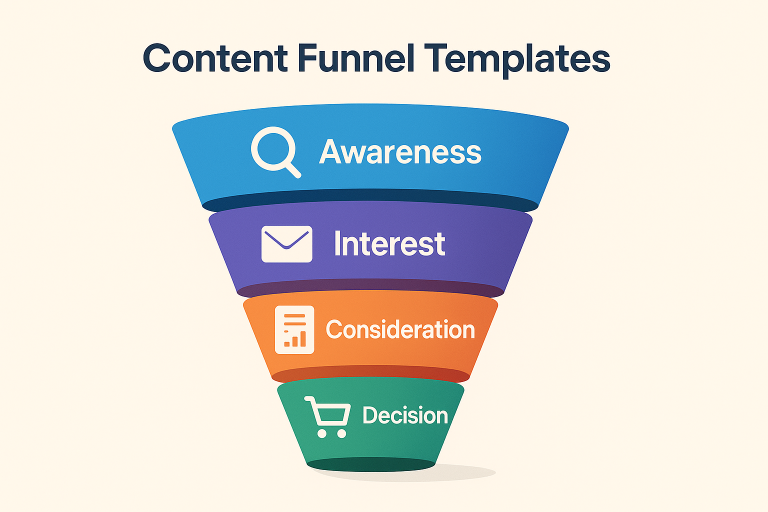
The typical content funnel progresses from awareness to decision, with distinct stages that each serve different purposes:
- Awareness (Top of Funnel): Introduces your brand to potential customers who are discovering their problems
- Consideration (Middle of Funnel): Educates prospects who are actively researching solutions
- Conversion (Bottom of Funnel): Persuades qualified leads to become customers
- Retention (Post-Purchase): Supports existing customers and encourages loyalty
Each stage requires different content types and, consequently, different metrics to measure effectiveness. Understanding this structure helps you connect specific metrics to business objectives, ensuring you’re tracking what truly matters for growth.
How to Build an Effective Content Metrics Framework
Before tracking individual metrics, you need a strategic framework that aligns with your specific business objectives and content goals. This prevents you from chasing vanity metrics that look impressive but don’t impact your bottom line.
Follow these steps to build your content metrics framework:
- Define business objectives: Identify what your business needs to achieve (revenue growth, lead generation, customer retention)
- Map content goals to each objective: Determine how content supports each business goal
- Select relevant metrics for each goal: Choose metrics that directly measure progress toward specific goals
- Establish benchmarks: Set baseline measurements to track improvement
- Create reporting cadence: Determine how often to analyze and report on each metric
Different business types require different metrics. For example, e-commerce companies should prioritize direct conversion metrics, while B2B companies with longer sales cycles might focus more on engagement and lead nurturing metrics.
For small teams, free tools like Google Analytics, Google Search Console, and social media native analytics can provide sufficient data. Larger organizations might benefit from comprehensive solutions like Semrush, Ahrefs, or HubSpot that integrate multiple data sources.
Top-of-Funnel Content Metrics: Measuring Awareness and Reach
Top-of-funnel metrics measure how effectively your content attracts and engages your target audience at the initial discovery stage. These metrics help you understand your content’s visibility and audience growth.
- Organic traffic: Monthly visitors from search engines, indicating content visibility and SEO effectiveness
- New visitors: First-time website visitors, showing audience expansion
- Traffic by channel: Visitor sources (search, social, direct, referral), helping optimize distribution
- Impressions: How often your content appears in search results or social feeds
- Click-through rate (CTR): Percentage of impressions that result in clicks
- Social media reach: Number of unique users who see your content on social platforms
- Keyword rankings: Positions for target keywords in search results
Benchmark data varies by industry, but average CTRs for position one in Google typically range from 20-30%, while positions 6-10 average below 3%. For social media, engagement rates of 1-3% are considered good for most industries.
Avoid the common pitfall of focusing solely on traffic volume without considering traffic quality or alignment with your target audience.
Website Traffic and Source Attribution
Measuring overall traffic is just the starting point—understanding where that traffic comes from and how it relates to your content strategy provides deeper insights.
To properly track traffic sources:
- Set up proper UTM parameters for all content promotions (utm_source, utm_medium, utm_campaign)
- Create custom channel groupings in Google Analytics to isolate content marketing efforts
- Track referral traffic to identify potential partnership opportunities
- Monitor direct traffic increases after content campaigns to measure brand awareness
With GA4’s event-based model, focus on configuring the right events to track user interactions with your content. Set up events for scroll depth, video plays, and PDF downloads to get a complete picture of engagement.
Best practice: Create visualization dashboards that show traffic trends over time alongside content publication dates to identify correlations between specific content pieces and traffic spikes.
Content Engagement and Attention Metrics
Beyond basic pageviews, engagement metrics reveal how deeply your audience interacts with your content. These metrics help determine whether your content resonates with visitors.
Key engagement metrics comparison:
| Metric | What It Measures | Benchmark |
| Average time on page | How long visitors stay on content | 2-3 minutes for blog posts |
| Scroll depth | How far down the page users scroll | 50-60% average scroll depth |
| Bounce rate | Single-page sessions without interaction | 40-60% for content sites |
| Pages per session | Number of pages viewed in one visit | 2-3 pages for content sites |
Different content types have different engagement benchmarks. For example, in-depth guides typically have longer time-on-page (4+ minutes) but higher bounce rates than product pages.
GA4’s “engagement rate” metric (sessions that lasted 10+ seconds, had a conversion event, or had 2+ page views) offers a more comprehensive view of meaningful interactions than the traditional bounce rate.
Social Media Amplification Metrics
Social media metrics indicate how shareable and conversation-worthy your content is among your target audience. These metrics reflect content resonance and potential viral reach.
- Shares/Retweets: How often users share your content with their networks
- Comments: Level of discussion your content generates
- Saves/Bookmarks: Indicates high-value content users want to reference later
- Mentions: Brand or content references across social platforms
Platform-specific metrics matter too: LinkedIn’s “post views” and “profile visits from post,” Facebook’s “people reached” versus “engagement,” and Instagram’s “saves” are particularly valuable indicators of content impact.
Tools like Hootsuite, Buffer, or Sprout Social can track these metrics across platforms, while BuzzSumo can measure content shares and identify top-performing topics.
Middle-of-Funnel Content Metrics: Tracking Consideration and Interest
Middle-of-funnel metrics track how effectively your content moves prospects from basic awareness to active consideration of your solutions. These metrics reveal deeper engagement and interest in your offerings.
- Return visitor rate: Percentage of visitors who come back, indicating continued interest
- Email sign-up conversion rate: Visitors who subscribe to content updates
- Content downloads: Leads who access gated content resources
- Webinar/event registrations: Sign-ups for educational events
- Blog-to-product page flow: Content readers who visit solution pages
- Average content consumption: Number of content pieces viewed per user
Good benchmarks include return visitor rates of 15-30%, email sign-up rates of 1-5% from blog content, and PDF download rates of 2-7% for ungated content with strong calls to action.
Mid-funnel content typically includes comparison guides, case studies, webinars, and in-depth how-to content that helps prospects evaluate solutions.
Return Visitor and Content Consumption Patterns
Return visitor metrics and content consumption patterns reveal how effectively your content strategy builds ongoing relationships with your audience.
To track content consumption patterns:
- Create content groupings in analytics based on topics or funnel stages
- Analyze common content sequences (what users read before converting)
- Track topic cluster engagement (how users navigate related content)
- Measure time between content interactions (engagement frequency)
Visualization tools like Google Data Studio can help create user flow diagrams showing how visitors navigate between content pieces, revealing which content combinations lead to deeper engagement.
HubSpot research shows that leads who consume 3+ pieces of content have a 20% higher conversion rate than those who read just one piece, making tracking these patterns essential for optimizing conversion paths.
Lead Generation and Email Subscription Metrics
When visitors exchange their contact information for your content, it signals a significant step forward in the consideration process. These conversions represent tangible business value from your content.
Key lead generation metrics include:
- Content conversion rate: Percentage of visitors who become leads through content offers
- Lead magnet performance: Conversion rates by offer type
- Form completion rate: Percentage of users who begin a form and complete it
- Cost per content lead: Total content production and promotion cost divided by leads generated
Calculate content conversion rate: (Number of leads from content ÷ Total content visitors) × 100
Industry benchmarks vary widely, but average content conversion rates typically range from 1-5% for blog posts and 10-20% for landing pages with strong lead magnets.
To optimize form completion rates, follow best practices like minimizing form fields (5 or fewer), using multi-step forms for complex offers, and clearly communicating the value proposition.
Content-Specific Engagement Depth
Beyond basic engagement metrics, measuring how deeply prospects interact with specific pieces of consideration-stage content provides valuable insights about purchase intent.
- Video completion rate: Percentage of viewers who watch videos to completion (benchmark: 50-60% for 2-minute videos)
- Webinar attendance rate: Percentage of registrants who attend (benchmark: 40-50%)
- Interactive content completion: Users who finish assessments, calculators, or configurators
- Case study engagement: Time spent on case studies and related actions
For video content, track not just views but quartile completion rates (25%, 50%, 75%, 100%) to identify where viewers drop off.
Set up event tracking in your analytics platform to monitor specific interaction points, such as calculator usage, tool interactions, or specific sections viewed in longer content.
Bottom-of-Funnel Content Metrics: Measuring Conversion and Revenue Impact
Bottom-of-funnel metrics demonstrate how effectively your content contributes to conversions, revenue, and ROI—the metrics that matter most to business stakeholders. These metrics connect content directly to business outcomes.
- Content-influenced conversions: Sales/conversions where content played a role
- Content-attributed revenue: Direct revenue credited to content touchpoints
- Conversion rate by content type: Which content formats drive the most conversions
- Content ROI: Return on investment for content marketing efforts
- Sales cycle influence: How content affects sales cycle length
- Customer acquisition cost (CAC): Cost to acquire customers through content channels
According to Content Marketing Institute research, the average ROI for content marketing is 6:1 in B2B organizations, meaning $6 generated for every $1 spent.
Bottom-of-funnel content includes product comparisons, buying guides, customer testimonials, product demonstrations, and FAQs that directly support purchase decisions.
Content Attribution Models for Revenue
Attribution models determine how credit for conversions is assigned to different content touchpoints in the customer journey. Choosing the right model is crucial for accurately measuring content impact.
| Attribution Model | How It Works | Best For |
| First-touch | Gives 100% credit to first content interaction | Awareness-focused strategies |
| Last-touch | Gives 100% credit to final content before conversion | Bottom-funnel content evaluation |
| Linear | Distributes credit equally across all touchpoints | Balanced content ecosystem assessment |
| Time-decay | Gives more credit to touchpoints closer to conversion | Sales-focused content programs |
| Position-based | Gives 40% to first and last touch, 20% to middle | Balanced awareness and conversion focus |
| Data-driven | Uses algorithmic analysis to assign credit | Large-scale content programs with sufficient data |
Implementation options vary by business size:
- Small businesses: Use UTM parameters and Google Analytics 4’s basic attribution models
- Mid-size companies: Consider HubSpot, Marketo, or similar marketing automation platforms
- Enterprise: Evaluate Bizible, Full Circle Insights, or custom attribution solutions
In my 14 years of marketing experience, I’ve found that position-based attribution provides the most balanced view for most content marketing programs, recognizing both the critical first touch that initiates the relationship and the final content that drives conversion.
Content ROI Calculation Methodologies
Calculating the true ROI of your content marketing requires connecting content costs to generated revenue through a systematic approach. This creates accountability and helps optimize content investments.
Follow these steps to calculate content marketing ROI:
- Track content costs: Sum all production costs (creation, design, promotion)
- Measure content-attributed revenue: Use your attribution model to determine revenue
- Calculate ROI: (Revenue – Cost) ÷ Cost × 100
For example:
Content costs: $5,000 (writing, design, promotion)
Content-attributed revenue: $30,000
ROI: ($30,000 – $5,000) ÷ $5,000 × 100 = 500%
For subscription businesses, factor in customer lifetime value impact by calculating the expected value of each conversion over time, not just initial purchase value.
Content costs should include:
- Internal team time (salaries proportional to time spent)
- Freelancer/agency fees
- Design and production costs
- Content promotion and distribution expenses
- Software tools used specifically for content
Track these costs in a dedicated spreadsheet or project management system with proper tagging to ensure accurate attribution.
Conversion Assist Analysis for Content
Beyond direct conversions, content often plays a critical supporting role in the conversion process that traditional attribution may miss. Conversion assist analysis reveals the complete picture of content’s impact.
To conduct conversion assist analysis:
- Identify content pieces that frequently appear in conversion paths but rarely get direct conversion credit
- Analyze content consumption sequences that lead to higher conversion rates
- Assign “assist value” to content based on its appearance in successful journeys
- Create visualization of common paths to purchase that include content touchpoints
GA4’s “Conversion Paths” report shows the sequence of user interactions leading to conversion, helping identify influential content that might be undervalued in simpler attribution models.
In my experience working with SaaS companies, I’ve found that detailed comparison content and “how to evaluate” guides often receive little direct conversion credit but appear in 60-70% of conversion paths, making them crucial assist content.
Retention and Loyalty Metrics: Measuring Post-Purchase Content Impact
Content marketing doesn’t end at conversion—retention metrics measure how effectively your content nurtures customer relationships and encourages repeat business. These metrics help extend customer lifetime value.
- Content engagement by existing customers: How active customers interact with content
- Knowledge base/help center usage: Support content utilization
- Customer education completion rates: Tutorial and onboarding content engagement
- Retention rate correlation: How content consumption affects renewal rates
- Customer-generated content: Reviews, testimonials, and user content creation
According to Forrester Research, customers who engage with educational content have 50% higher retention rates and 38% higher lifetime value than those who don’t.
Effective retention content includes onboarding guides, advanced usage tutorials, customer newsletters, product updates, user communities, and success stories that reinforce purchase decisions.
Customer Education and Onboarding Metrics
Effective customer education content reduces churn, improves satisfaction, and increases product adoption—making these metrics critical for subscription businesses.
Key customer education metrics include:
- Onboarding completion rate: Percentage of new customers who complete the onboarding sequence
- Feature adoption rate: Correlation between tutorial consumption and feature usage
- Knowledge base article effectiveness: How help content reduces support tickets
- Training certification completion: Formal customer education program results
For SaaS businesses, customers who complete onboarding content experience 50-80% lower churn rates in the first 90 days compared to those who don’t engage with educational materials.
Set up tracking that connects content consumption to key product usage metrics and support ticket submission rates to quantify the impact of educational content on customer success.
Customer Advocacy and Content Sharing Metrics
When customers share your content or create their own content about your brand, they become powerful advocates that extend your reach and credibility. These metrics measure word-of-mouth amplification.
- User-generated content volume: Customer reviews, social posts, and testimonials
- Content sharing by customers: How often customers distribute your content
- Referral traffic from customer channels: Visitors from customer-shared links
- Testimonial and case study participation: Customer willingness to be featured
Tools like Mention, Brand24, or Hootsuite can track brand mentions and customer-created content across digital channels, while referral codes can measure direct customer-driven conversions.
According to Nielsen research, 92% of consumers trust recommendations from people they know over any other form of advertising, making customer advocacy content particularly valuable.
Building Effective Content Marketing Dashboards
A well-designed content marketing dashboard brings together the most important metrics from each funnel stage to provide actionable insights at a glance. Effective dashboards make data accessible and drive decision-making.
Follow these steps to create effective content dashboards:
- Define primary audience: Determine who will use the dashboard (executives, content team, etc.)
- Select key metrics: Choose 5-7 most important metrics for that audience
- Establish time frames: Set consistent time periods for trend analysis
- Create visualizations: Use charts and graphs appropriate for each metric type
- Add context: Include targets, benchmarks, and explanatory notes
Popular dashboard tools include:
- Google Data Studio (free, good integration with Google products)
- Tableau (enterprise-level visualization capabilities)
- Power BI (Microsoft’s solution with strong Excel integration)
- Databox (specialized marketing dashboard with pre-built templates)
Update executive dashboards monthly, while content team operational dashboards should be reviewed weekly for timely optimization.
Executive Dashboards for Content Performance
Executive dashboards focus on high-level business impact metrics that demonstrate content marketing’s contribution to company goals. These dashboards connect content to business outcomes that executives care about.
Essential metrics for executive reporting include:
- Content-attributed revenue: Direct financial impact of content
- Content ROI: Return on content marketing investment
- Conversion trends: Month-over-month conversion performance
- Market share indicators: Share of voice and competitive position
- Cost per acquisition: Efficiency of content vs. other channels
Visualization best practices:
- Use simple, clear charts that communicate trends at a glance
- Include previous period comparisons to show growth
- Add industry benchmarks when available
- Limit to one page or screen for quick consumption
From my experience presenting to C-suite executives, the most effective executive dashboards focus on financial impact first, with supporting metrics that explain how content drives business results. This approach has proven much more effective than starting with engagement metrics that executives may view as vanity metrics.
Operational Dashboards for Content Teams
Content team dashboards focus on actionable metrics that guide day-to-day decisions and content optimization efforts. These dashboards help content creators improve performance.
Key components for content team dashboards:
- Content performance by type: Which formats drive the best results
- Topic performance analysis: Which subjects resonate most
- Keyword ranking trends: SEO visibility improvements
- Content gaps: Underperforming funnel stages or topics
- Engagement trends: How audience interaction is changing
Effective content team dashboards include filtering capabilities to analyze performance by content type, topic, funnel stage, and target audience, enabling specific optimization insights.
Consider creating separate dashboard views for different team roles: SEO-focused for content strategists, engagement-focused for content creators, and conversion-focused for content marketers managing campaigns.
Privacy-Compliant Measurement in a Cookieless World
Privacy regulations and technology changes are transforming how content marketing is measured—requiring new approaches to maintain accurate tracking. Adapting to these changes is essential for sustainable measurement.
Key privacy challenges affecting content measurement:
- iOS privacy changes limiting tracking across apps and websites
- Third-party cookie deprecation in Chrome and other browsers
- GDPR, CCPA, and other privacy regulations requiring explicit consent
- Ad-blockers and tracking preventions reducing data collection
Strategies for privacy-compliant measurement:
- First-party data focus: Collect data directly through your owned platforms
- Server-side tracking: Implement server-side GTM and analytics
- Contextual analysis: Measure content performance based on context, not personal identifiers
- Content grouping: Track content category performance instead of individual user journeys
- Cohort analysis: Analyze behavior of similar user groups rather than individuals
Google’s Privacy Sandbox, specifically the Topics API, will replace some functionality currently provided by cookies, allowing interest-based measurement without individual tracking.
For long-term measurement strategy, prioritize building first-party data relationships through email subscriptions, account creation, and progressive profiling that provide value in exchange for data sharing.
Advanced Content Analytics: AI and Predictive Approaches
As content analytics evolves, AI and machine learning offer new ways to predict content performance and optimize strategies proactively. These advanced approaches help marketers make data-driven decisions before content is even created.
Emerging AI applications for content measurement:
- Content performance prediction: Algorithms that forecast how new content will perform based on historical data
- Natural language processing (NLP): Automated content analysis for sentiment, readability, and topic modeling
- Semantic content clustering: AI grouping of content by meaning rather than keywords
- Predictive engagement modeling: Forecasting which content types will engage specific audience segments
- Automated content optimization: AI-driven recommendations for improving content
AI-powered tools worth exploring:
- MarketMuse for content optimization and gap analysis
- Clearscope for content effectiveness prediction
- HubSpot’s content strategy tool for topic clustering
- Google’s Natural Language API for content classification
Looking ahead, federated learning approaches will allow content performance measurement while preserving privacy by keeping user data on devices and only sharing aggregate insights.
Building a Data-Driven Content Strategy
Tracking the right content funnel metrics isn’t just about measuring performance—it’s about building a continuously improving, data-driven content strategy. When properly implemented, these metrics create a feedback loop that drives ever-improving results.
To implement your measurement framework:
- Start with 3-5 core metrics that directly connect to your primary business objectives
- Build proper tracking systems before scaling content production
- Establish a regular review cadence to analyze performance
- Create standardized optimization protocols based on data insights
- Gradually expand your measurement framework as you master the basics
Remember that different stakeholders need different metrics. Getting started with content marketing ROI measurement requires mapping the right metrics to each audience.
Content measurement should be viewed as an ongoing journey, not a destination. The most successful content marketers continuously refine their measurement approaches, testing new metrics and discarding those that don’t drive meaningful insights.
For advanced learning, explore resources from Content Marketing Institute, Andy Crestodina’s Orbit Media content research, and Avinash Kaushik’s Occam’s Razor blog for cutting-edge measurement approaches.
With the right content funnel templates and corresponding metrics, you can transform your content from a cost center to a revenue-generating engine with clearly demonstrable ROI. Start measuring what matters today.